

Do covid vaccines save lives?
Do covid vaccines stop the spread of covid?
Initial data exploration of covid data
From these statistics, we can draw the following insights:
Location: There are 64 unique locations in the dataset.
Cases Sum: The average number of cases is 12,074, with a standard deviation of 9,843.89. The minimum is 290.279, and the maximum is 16,387.8.
Deaths Sum: The average number of deaths is 155.157, with a standard deviation of 156.486. The minimum is 0.196, and the maximum is 212.389.
Positive AUC: The average positive AUC (Area Under the Curve) is 7.88995, with a standard deviation of 8.57415.
Death Pos AUC: The average death positive AUC is 33.7196, with a standard deviation of 43.8713.
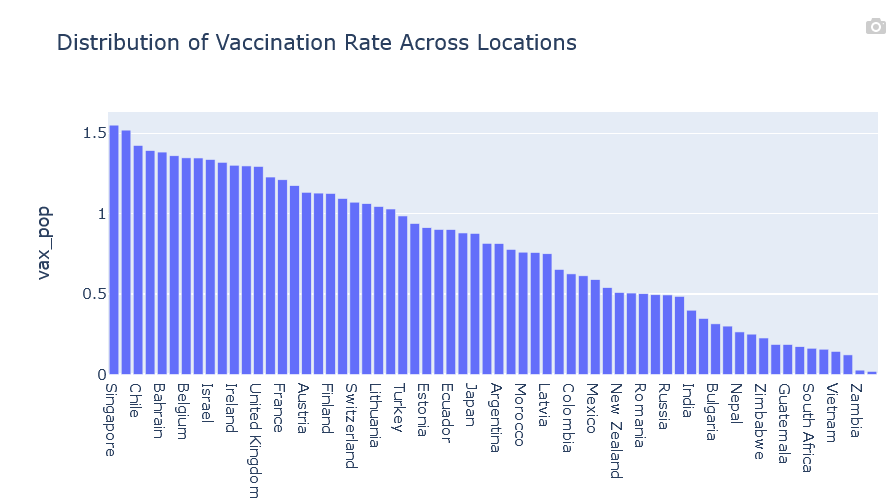
Vax Pop: The average vaccination rate is 0.789625, with a standard deviation of 0.4398.
Hospital Beds Avg: The average number of hospital beds is 3.62377, with a standard deviation of 2.65223.
Diabetes Prevalence: The average diabetes prevalence is 7.39578, with a standard deviation of 3.11247.
Aged 70 Older: The average percentage of the population aged 70 or older is 8.42772, with a standard deviation of 4.49123.
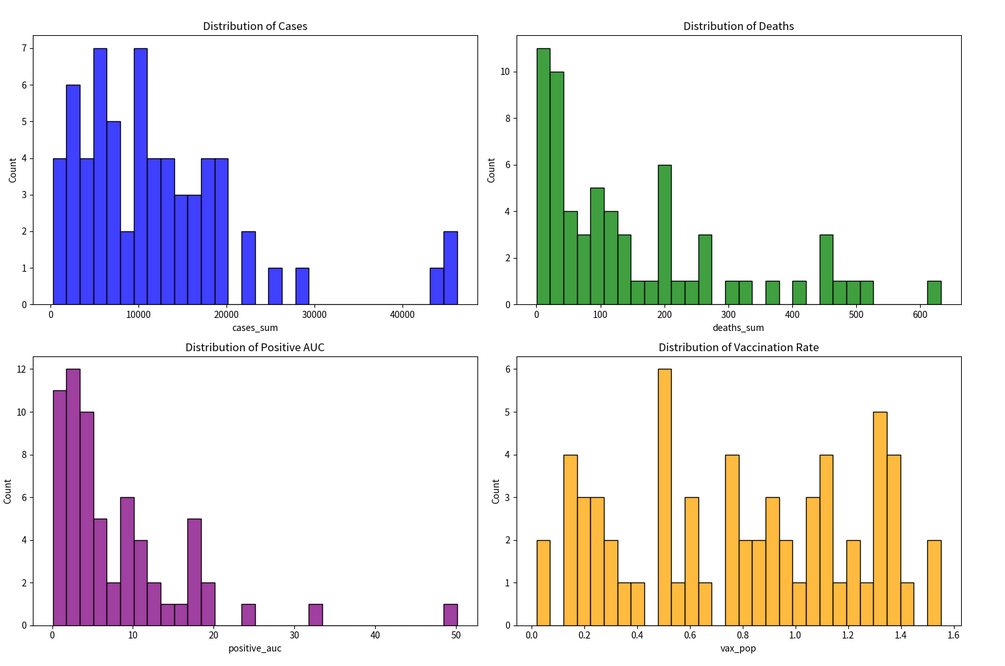
From these histograms, we can draw the following insights:
1. Distribution of Cases: The number of cases is skewed to the right, indicating that most of the locations have a relatively low number of cases, while a few locations have a very high number of cases.
2. Distribution of Deaths: The number of deaths is also skewed to the right, indicating that most of the locations have a relatively low number of deaths, while a few locations have a very high number of deaths.
3. Distribution of Positive AUC: The distribution of the positive AUC (Area Under the Curve) is somewhat uniform, indicating that the rate of positive test results varies widely across different locations.
These insights can help us understand the spread and impact of COVID-19 across different locations, as well as the effectiveness of vaccinations.
Results of the linear regression model:
Features effects on covid deaths
- The model's R-squared value is 0.634, which means that about 63.4% of the variation in the number of deaths can be explained by the predictors in the model. The adjusted R-squared value is 0.548, which takes into account the number of predictors in the model.
- The F-statistic is 7.359, and the associated p-value is very small (1.33e-07), indicating that at least some of the predictors are statistically significant.
- The coefficients represent the change in the number of deaths for a one-unit change in the predictor, while holding all other predictors constant. For example, a one-unit increase in 'cases_sum' is associated with an increase of 0.5736 in 'deaths_sum', on average.
- The p-values test the null hypothesis that each coefficient is equal to zero. A small p-value (typically less than 0.05) indicates strong evidence that the coefficient is different from zero.
Here are the coefficients and p-values for each predictor:
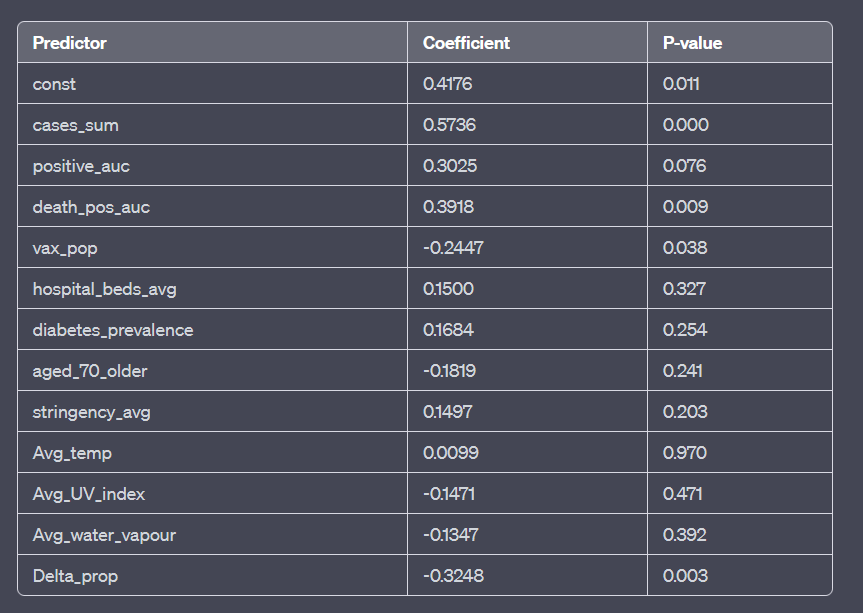
From these results, we can see that 'cases_sum', 'death_pos_auc', 'vax_pop', and 'Delta_prop' are statistically significant predictors of 'deaths_sum', as their p-values are less than 0.05.
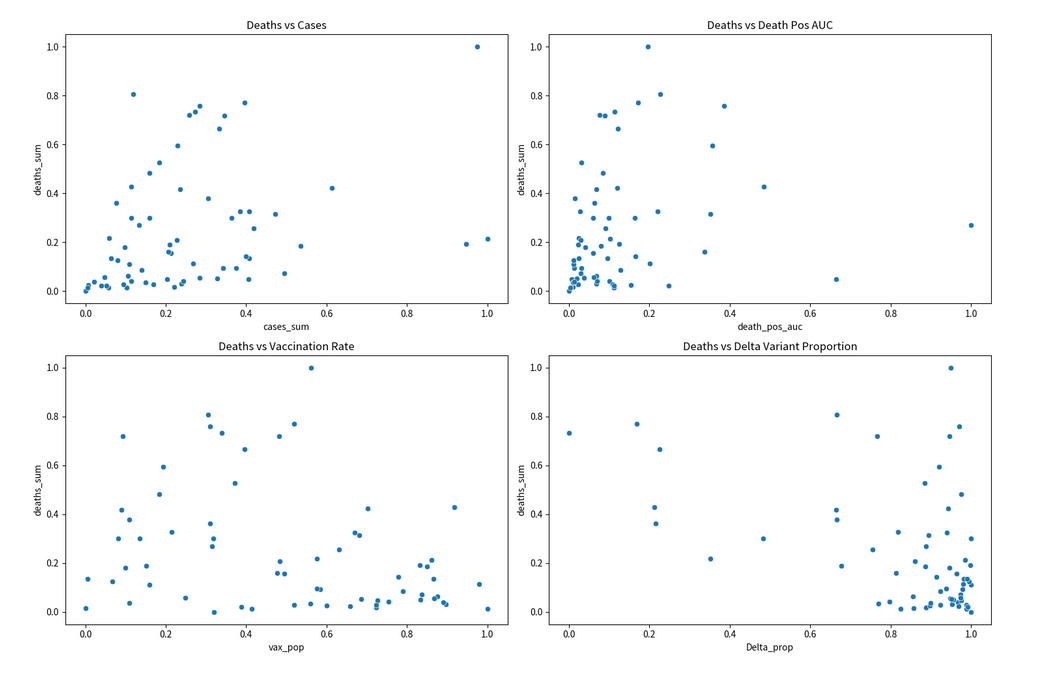
We can observe the following:
1. Deaths vs Cases: There is a positive correlation between the number of cases and the number of deaths. This is expected as more cases would naturally lead to more deaths.
2. Deaths vs Death Pos AUC: There is also a positive correlation between the death positive area under the curve (AUC) and the number of deaths. This suggests that locations with a higher death rate among positive cases tend to have more deaths.
3. Deaths vs Vaccination Rate: There is a negative correlation between the vaccination rate and the number of deaths. This indicates that locations with a higher vaccination rate tend to have fewer deaths in the older population.
4. Deaths vs Delta Variant Proportion: There is a negative correlation between the proportion of the Delta variant and the number of deaths. This might seem counterintuitive as the Delta variant is known to be more transmissible, but also covid variants become less deadly over time.
Effectively catching the Delta variant, and presumably other later variants of covid, saved more lives than being vaccinated against covid.
Effects on amount of covid cases
Model Summary:
- R-squared: 0.518 (This indicates that approximately 51.8% of the variability in the 'cases_sum' can be explained by the model.)
- Adjusted R-squared: 0.405 (This is the adjusted R-squared that takes into account the number of predictors in the model.)
- F-statistic: 4.568 (This is the test statistic for the overall significance of the model.)
- Prob (F-statistic): 5.77e-05 (This is the p-value for the overall significance of the model, indicating that the model is statistically significant.)
Coefficients and P-values:
Constant: Coefficient = -0.3900, P-value = 0.017
deaths_sum: Coefficient = 0.5668, P-value < 0.001
vax_pop: Coefficient = 0.3739, P-value = 0.001
Avg_UV_index: Coefficient = 0.4193, P-value = 0.035
Delta_prop: Coefficient = 0.2449, P-value = 0.025
Key Insights:
- The 'deaths_sum' has a strong positive influence on 'cases_sum', with a coefficient of 0.5668 and a highly significant p-value.
- The 'vax_pop' (vaccination population) and 'Avg_UV_index' also have positive effects on 'cases_sum'.
- The 'Delta_prop' (Delta variant proportion) has a positive effect on 'cases_sum', indicating that higher Delta variant proportions are associated with more cases.
Vaccinations affects on covid cases
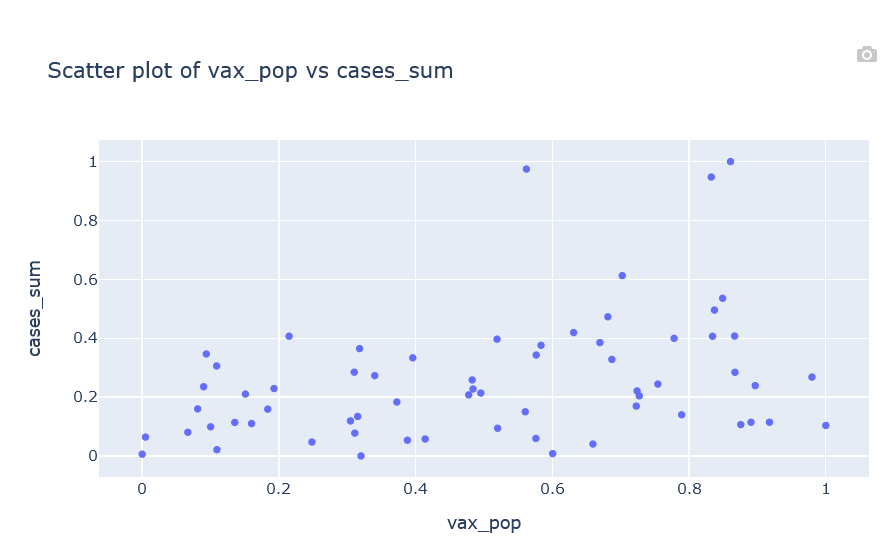
Here's what this tells us about the influence that vaccination has on covid cases:
Positive Coefficient: The positive coefficient of 0.3739 indicates that there is a positive relationship between the vaccination population ('vax_pop') and the total number of cases ('cases_sum'). In other words, as the vaccination population increases, the total number of cases also tends to increase.
Statistical Significance: The p-value of 0.001 is less than the common significance level of 0.05, indicating that the effect of 'vax_pop' on 'cases_sum' is statistically significant. This means that the observed relationship is unlikely to have occurred by random chance.
Interpretation: The positive relationship between 'vax_pop' and 'cases_sum' might seem counterintuitive at first, as one might expect that higher vaccination rates would lead to fewer cases.
It's important to note that correlation does not imply causation, and the observed relationship between 'vax_pop' and 'cases_sum' does not necessarily mean that increasing vaccination rates cause an increase in cases. Other underlying factors and context must be considered, and further analysis may be needed to understand the causal mechanisms at play
Conclusion
Yes the vaccines saved lives, but the spread of newly formed covid variants saved even more. Vaccines certainly did not stop the spread of covid. This data and research cannot tell an individual to take or not take a vaccine, just that the covid vaccine programs did not go as well as planned. Most people were better off just getting natural immunity from the later variants of covid.
References
Coronavirus Pandemic (COVID-19). Our World in Data.
https://ourworldindata.org/coronavirus
GitHub - Covid data science.